Enterprise reports overview
Enterprise reports is the advanced report catalogue in Ordering Dashboard. It is separate from Business reports, Delivery reports, and Payment reports. Use it to select an individual operational or commercial report, then review its results in the report panel.
The fixed Dashboard route for Enterprise reports accepts level 0 and has no Enterprise-plan condition in the inspected route guard. The sidebar item requires Enterprise and can nevertheless render for a level-2 Business owner when item 5 is included, even though the route guard does not accept level 2. The Reports parent excludes levels 5 and 8 plus read-only classifications. Route access, sidebar visibility, plan state, and API authorization are separate controls.
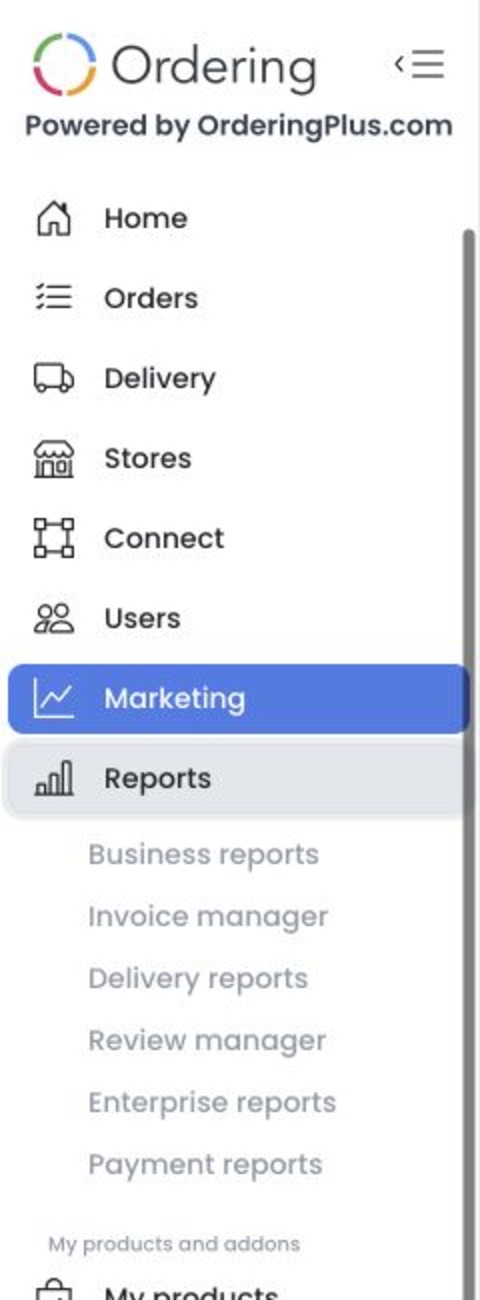
The Reports menu also contains other report surfaces. This guide covers Enterprise reports only; use the menu label to avoid confusing it with Business, Invoice, Delivery, Review, or Payment reports.
Open Enterprise reports
- In the Dashboard sidebar, select Reports.
- Select Enterprise reports.
- Select a report card to open its panel.
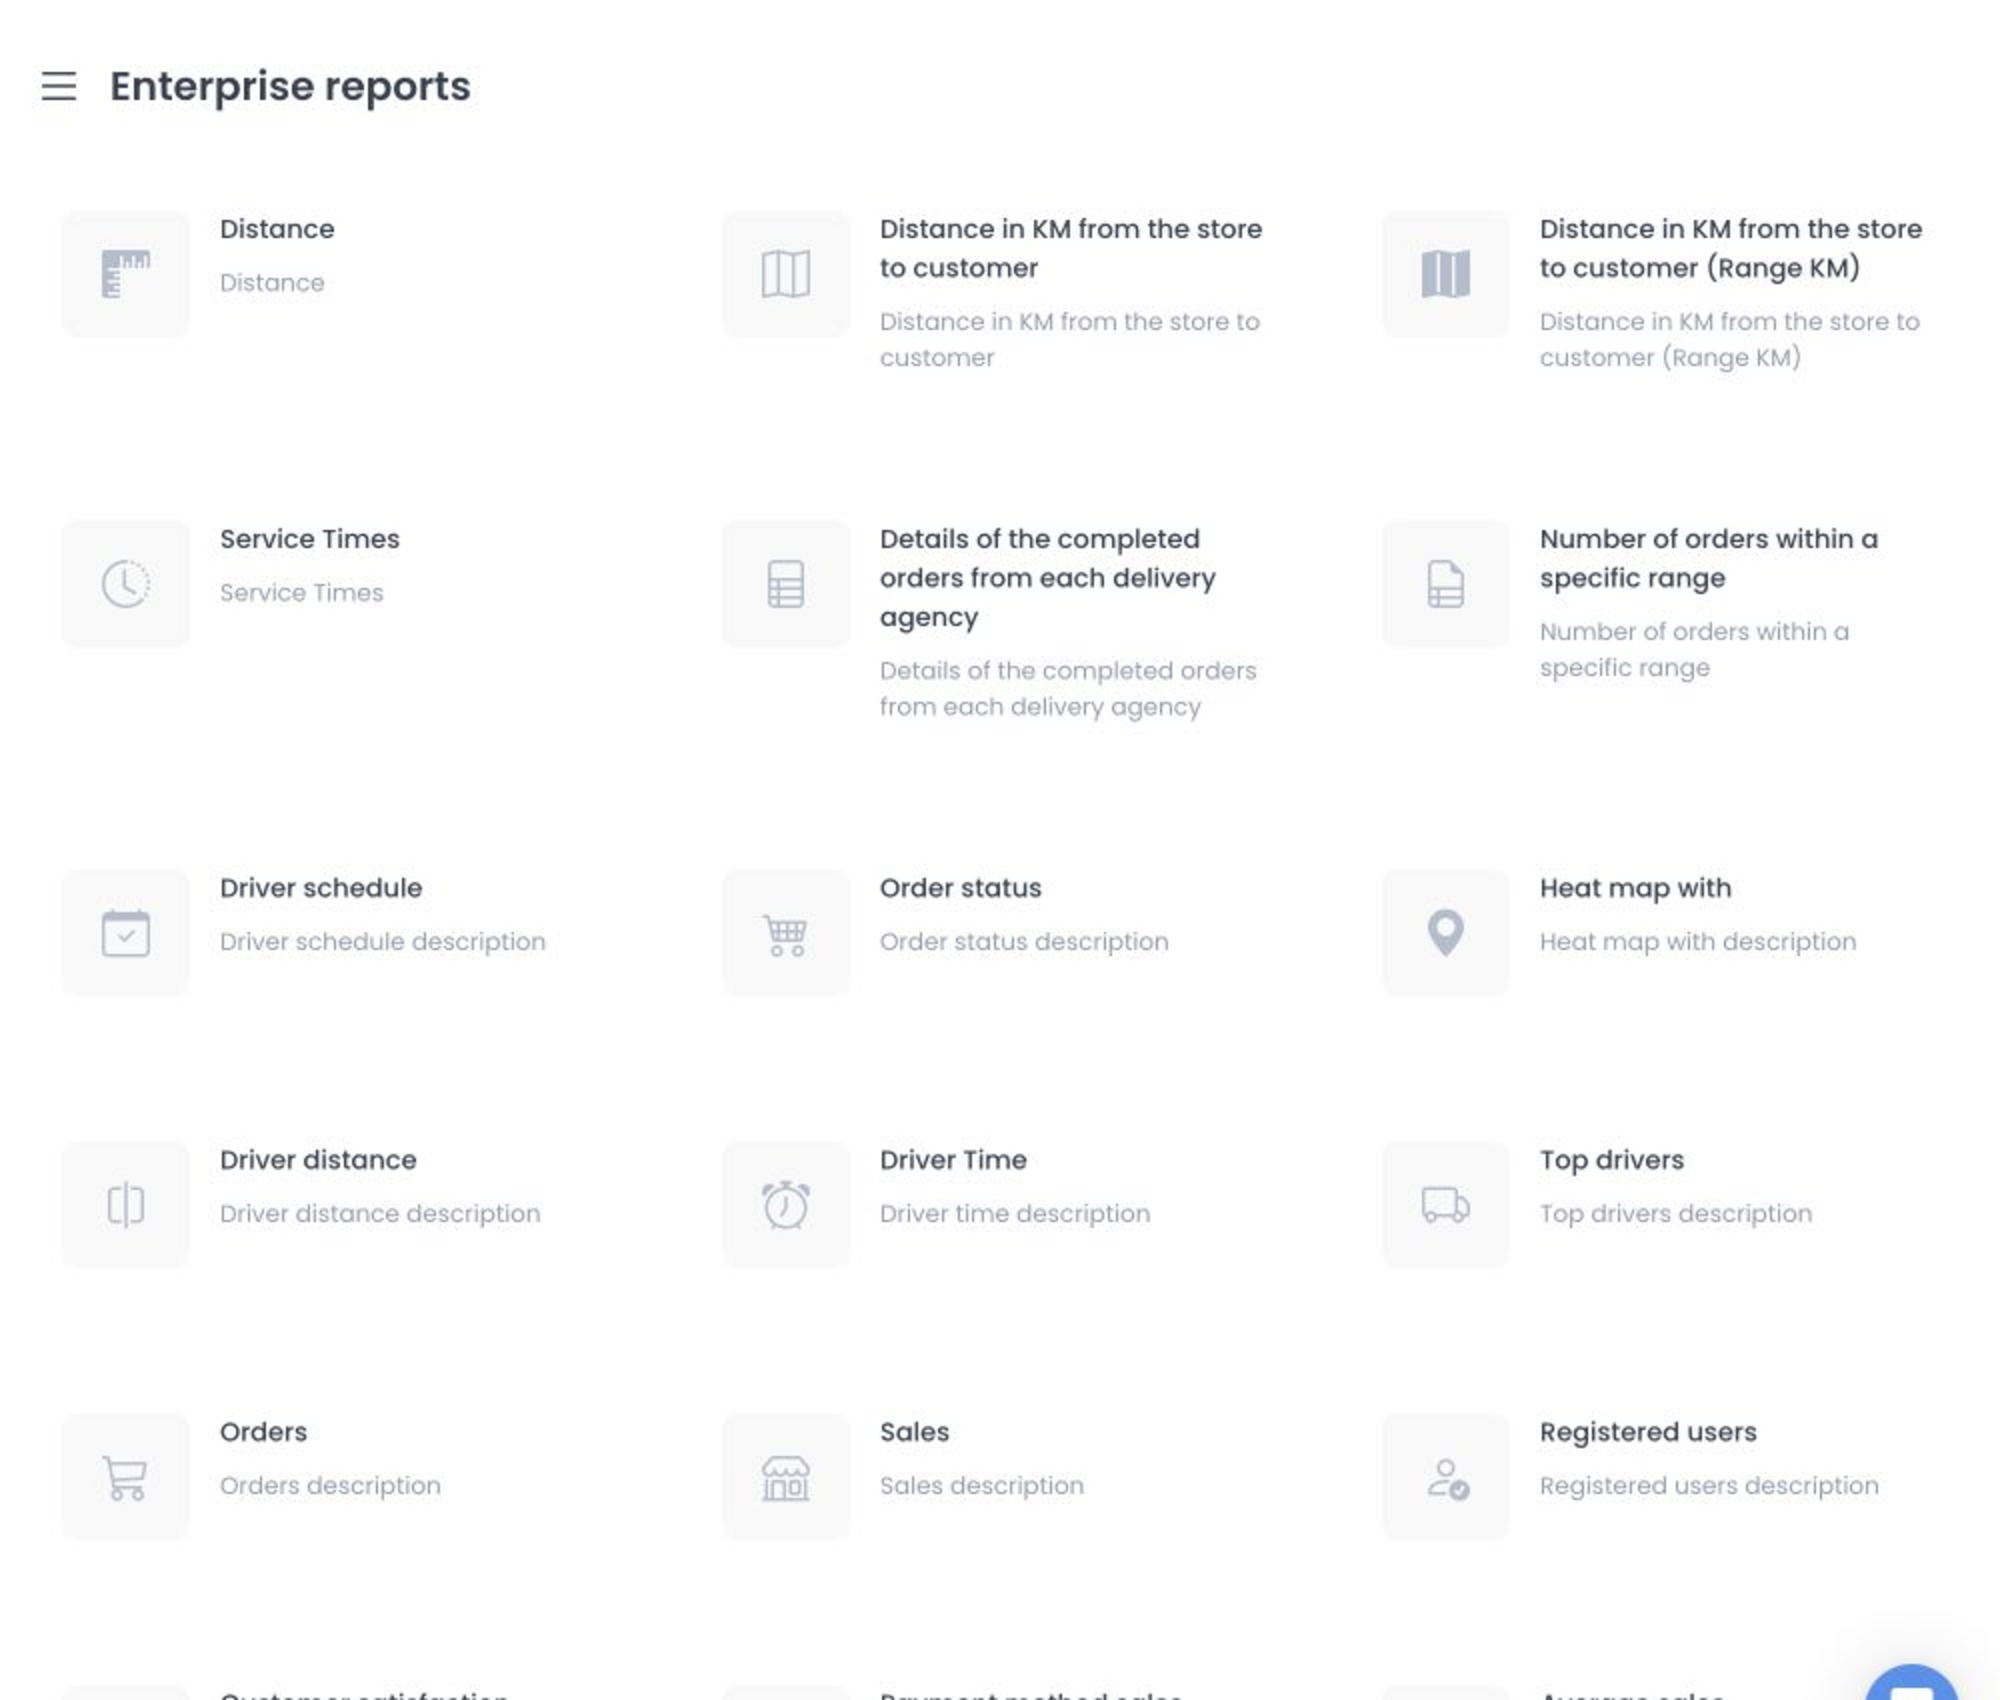
Selecting a card opens that report in a side panel and adds its selection to the page URL. Close the panel to return to the catalogue.
This catalogue and its 21 card labels are verified from the pinned client source only. They do not prove that the same code is deployed or that any report endpoint will authorize or return data.
This page remains the single maintained Enterprise reports overview. The legacy ecommerce-reports catalogue is an audit-only conditional pointer here, not a standalone public page or direct-route entitlement. The duplicate historical Enterprise reports control is also owned by this page; neither mapping creates a merge, redirect, replacement, or new page.
Choose a report
The current catalogue includes these report types:
- Distance, Distance in KM from the store to customer, and Distance in KM from the store to customer (Range KM).
- Service Times, Detail of the completed orders of each delivery agency, and Number of orders within a specific range.
- Driver schedule, Order status, Heat map with, Driver distance, Driver Time, and Top drivers.
- Orders, Sales, Register users, Customer satisfaction, Paymethod sales, Average sales, General sales, and Top selling and category.
- SLA orders.
This is a catalogue, not a single common report template. A card can have its own result layout, available controls, and download behavior. Do not expect every report to have the same filters, table, or CSV action.
Set filters and period
Use the controls shown in the selected report panel. Depending on the report, you may see a date range, timezone, Business or Brand selection, Driver group, Driver, order type, app, or delivery-company filter.
Most report cards initially use the last seven days through today. Some reports use a different starting period, so review the control values before interpreting the result.
The selected timezone is not only a display preference. Dashboard sends the date range in that timezone, and the report service converts the resulting bounds for its query. Changing timezone can move records into or out of a displayed day and can change the aggregation resolution for the selected period.
Opening a selected card triggers authenticated report requests as its filters initialize or change. No card, URL query, GET request, or download was run for this documentation; GET and HEAD were not treated as safe probes.
For a custom period, use the date control in the selected report and confirm the start and end dates before sharing conclusions. The available period and filters are report-specific.
Review results carefully
Enterprise reports can contain sales, order volumes and statuses, payment methods, products and categories, customer-satisfaction aggregates, driver or delivery-company details, schedules, names, identifiers, and timing or distance metrics. Treat the result as sensitive operational and commercial information.
The Heat map with report requires extra care: its supporting data can include customer order latitude and longitude. Do not expose map markers, locations, names, identifiers, or live report results in screenshots or external materials.
Download CSV files
Some report panels show a download icon. When available, the Dashboard creates a CSV in the browser from the report results that are already loaded. It is not a separate server-side export workflow, and its structure can differ by report. For example, an SLA orders download uses a filename beginning with completed_orders_ and a timestamp.
That source behavior is descriptive, not permission to export. The presence of a client-side download handler does not prove deployed availability, authorization, completeness, redaction, or a common schema across cards.
Before downloading or sharing a CSV, confirm that you are authorized to handle its contents. A file can include commercial metrics, names, identifiers, schedules, payment-related aggregates, and report-specific operational data. Do not assume a CSV is redacted or available for every report.
Troubleshooting
Why don't I see Enterprise reports?
The sidebar item requires the Enterprise plan and the Reports parent is role- and read-only-dependent. Ask an administrator to confirm plan, role, read-only classification, and Business-owner intelligence-item configuration; do not infer direct-route entitlement or API access from a missing or visible menu item.
Why is a filter or download icon missing?
Controls and downloads are implemented per report card. Open the relevant report and use only the controls it displays; another card's options do not imply availability here.
Why did totals change after I changed timezone?
The timezone changes the queried date boundaries, not merely the labels. Records near a day boundary can be included in a different displayed day or aggregation after the change.
Related guides: Business reports · Home overview